The Back Story
I stumbled across this comment from dbstealey over at WUWT ...At times not so long ago geologically, temperatures changed by TENS of degrees, within only a decade or two! If that happened now it would be catastrophic.... wherein he kindly provided this graphic as supporting evidence:

The Real Story
The data for that plot come from here:Alley, R.B.. 2004. GISP2 Ice Core Temperature and Accumulation Data.
IGBP PAGES/World Data Center for Paleoclimatology
Data Contribution Series #2004-013.
NOAA/NGDC Paleoclimatology Program, Boulder CO, USA.
Taking the slope of the temperatures for the past 10,000 years and doing some quick and dirty statistics, I find that the min/max rates of change are:
Min: -0.36/decade
Max: 0.36/decade
No typos there, it's simple coincidence that the absolute values of the min/max happen to be the same.
Digging Deeper
Buried in the bottom right corner is a caption which says "Mann's Hockey Stick". Which it isn't of course, it's just the tail end of the data from the GISP2 ice cores used in this particular study, which only contains temperature estimates up to 1850. This partially explains why handle of the stick looks a bit wimpy.The other problem with labelling that portion of the graph in such a way is that the infamous reconstruction from Mann, Bradley and Hughes (1998) is meant to represent the entire Northern Hemisphere, not just the tippy top of Greenland. Because temperatures at the poles are known to be more sensitive to change than the entire planet, naively comparing Alley (2004) to MBH98 would not be appropriate.
HADCRUT4 with the Cowtan & Way polar infilling and interpolations to the rescue.

Data obtained from KNMI Climate Explorer, using the coordinates 70-75 N, 30-35 W for Greenland Summit. These two time series only overlap by 6 years (1850-1855), but I took a full 31 years from 1850-1880 for a reference period anyway.
Final Thoughts
The min, max and average time resolution in the Alley (2000) study are 3, 80 and 13 years respectively. For the HADCRUT4 data, I calculated rates of change using 13-year samples and find that the min, max and average rates of change are -3.44, 1.71, 0.16 °C/decade. The overall rate for 1850-2014 is 0.14°C/decade.
I end with a shameless cherry-pick: the rate for 1970-2014 is 0.67 °C/decade, not quite double the maximum rate seen in the ice core data.
After Thoughts
It occurred to me that doing a rate plot for the entire Holocene plus the instrumental record might be interesting. Because I suspect the ice core data are somewhat noisy, and what we're really interested in here is rate of change since pre- vs. post-industrial times, I used a 160-year sample to calculate decadal rate of change over both periods: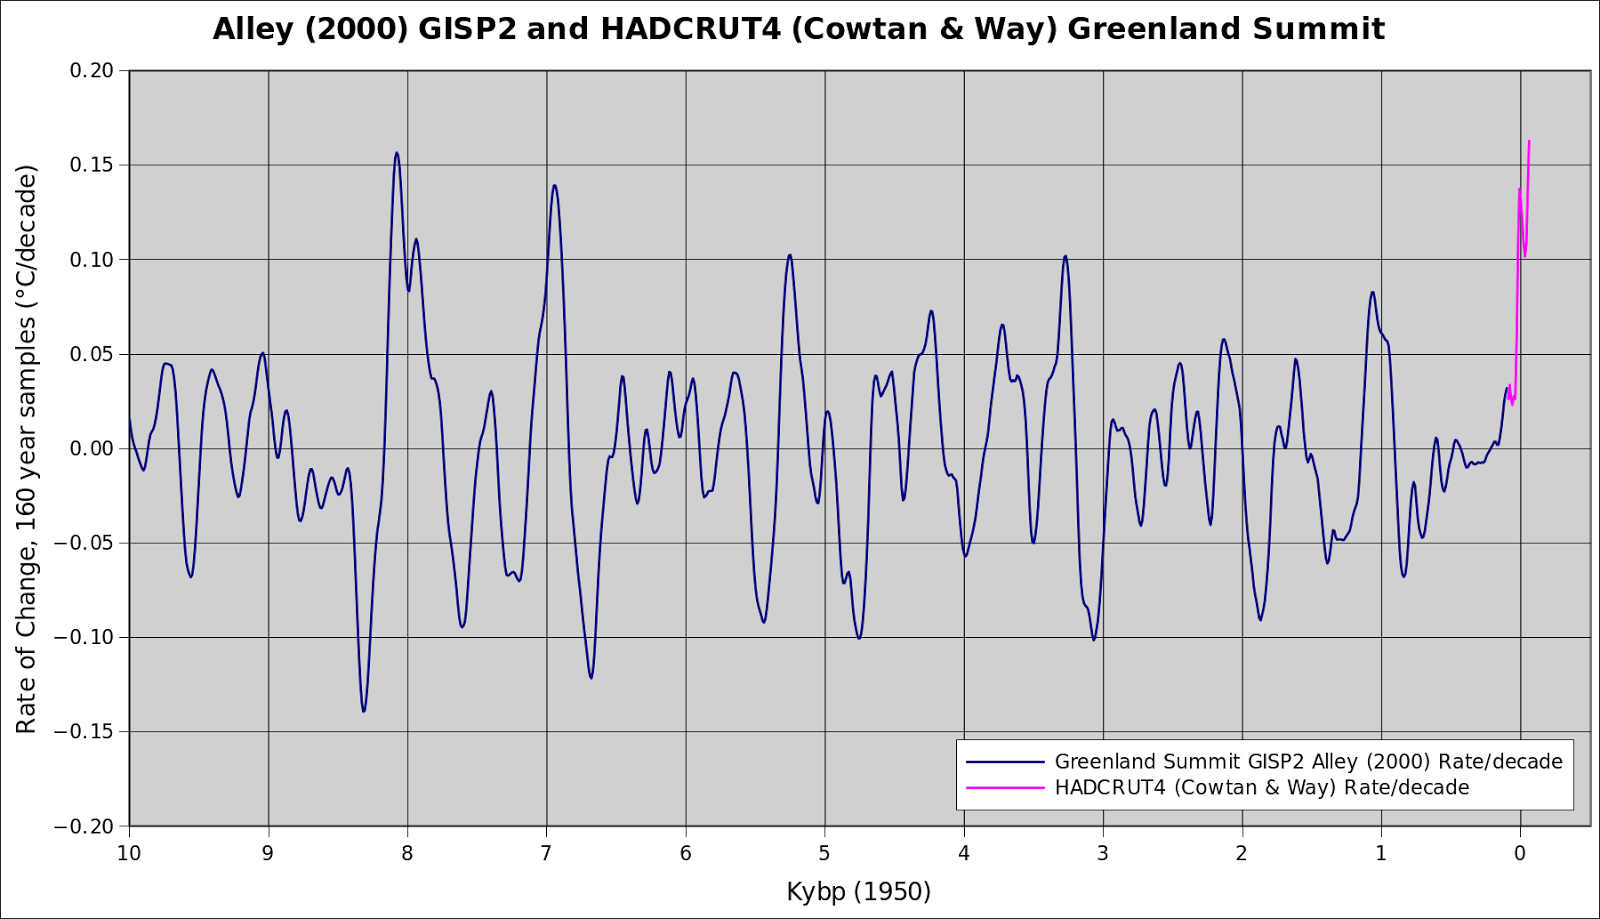
Update: Compare to MBH98
Not surprisingly, there's a bit of confusion about how volatile ice core time series are relative to hemispheric proxy reconstructions such as MBH98, so I did another plot:

Sort of puts things in proper perspective.
Update: More Comparisons to Instrumental Record


Update 2/8/2016
The previous plots assumed the years given in Alley (2000) were kyears before 2000 because that's how most plots on various contrarian blogs show it. Turns out, the data should be interpreted as kyears before 1950, which is the normal convention when no other reference year is given. That means Alley (2000) data end in 1854, not 1904. I have updated two plots with the corrected dating, and added in data from Vinther et al. (2009), which includes data up to 1970 (centered 20 year means).


Are these wonderful graphs public domain? niemicat@msn.com or Facebook Dorothy Prater Niemi
ReplyDeleteWow sorry for the delayed response. You may use these plots with attribution.
Delete