More to come ...
In response to, "The CO2 increase has been very roughly linear over time, so a log of that increase will FLATTEN as a function of time."
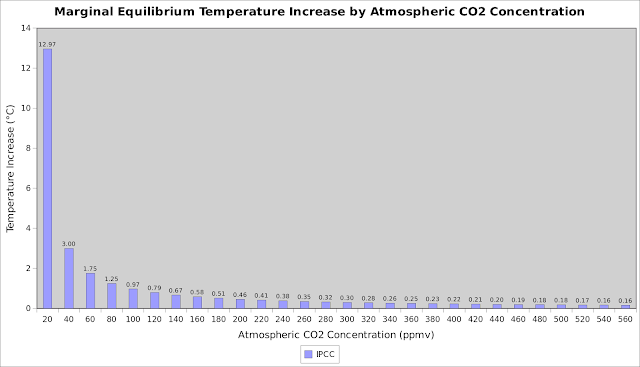
So, someone presented me with this plot:
I answered with this:
And this:
Update (2/3/2016)
Stealey's plot modified using 3 K/2xCO2 as the sensitivity parameter:


Brandon, can you get in touch with me via email?
ReplyDeleteDid you just get banned from WUWT?
ReplyDeleteI should check my blog for comments more often. No I have not been banned from WUWT ... lately I just haven't been moved to post there every day.
DeleteNice WUWT post
ReplyDelete" if the enforcement efforts were more equally applied to all participants here."
..
..
http://wattsupwiththat.com/2015/04/01/abusive-censorship-on-twitter-same-word-used-by-gavin-schmidt-gets-commenter-banned/#comment-1895797
Thank you. A lightbulb just went on ... I don't have your email address. I just exposed mine in my profile, feel free to reach out to me when you get this.
Delete