
Friday, January 30, 2015
Thursday, January 15, 2015
Jedeye Mind Tricks
... in a desperate attempt to fool Nature.

It's my favorite inaugural member of the Hall of Shame, and today the WTFUWTters gave me the perfect excuse to devote a post to it:
The Setup
So this chart has been distributed with laughably earnest intent on the Innert00bs of late:It's my favorite inaugural member of the Hall of Shame, and today the WTFUWTters gave me the perfect excuse to devote a post to it:
I’m pleased to see dbstealey’s graph of Global Warming. I presume it’s in degrees Fahrenheit? Did you graph it yourself?
I’d be grateful to see one prepared in Kelvin, and preferably with a link to the web page GISS has their data on, not merely to GISS said it, user can hunt through everything GISS ever said in order for user to find out where they said it.
If anyone can create such a graph I’d appreciate it.
Wednesday, January 14, 2015
Absolutely Abusing Anomalies
The Back Story
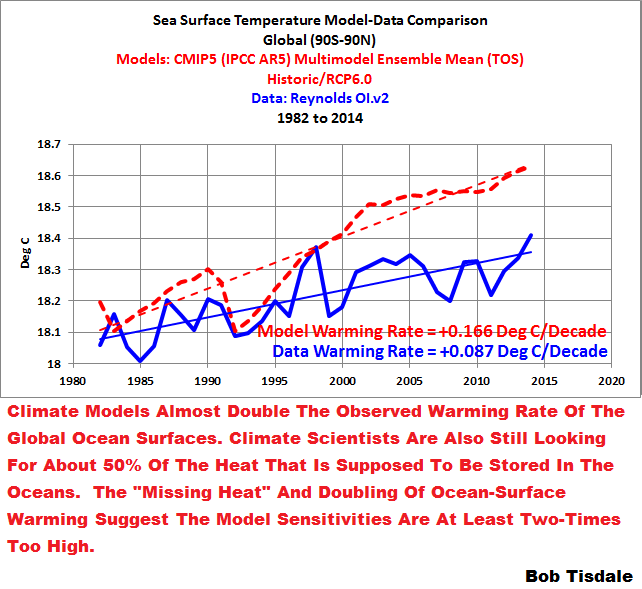
Bob Tisdale is a guy who makes a lot of charts and posts them on his own blog. Google his name and you can't miss it, or his graphics. He generally also cross-posts his work to WUWT, which is where I normally read him. A few days ago he wrote a post entitled Alarmists Bizarrely Claim “Just what AGW predicts” about the Record High Global Sea Surface Temperatures in 2014. It contains no fewer than 28 plots showing a bunch of stuff having to do with CMIP5 sea surface temperature output vs. observations from roughly 1982 to present. Why that date range? I'll let him explain:PRELIMINARY INFORMATIONSo far, so legit. But I'm getting ahead of myself here, because the only chart that matters here is the first one in the deck, which actually makes its appearance before the PRELIMINARY INFORMATION section:
The sea surface temperature dataset being used in this post is NOAA’s Optimum Interpolation (OI) Sea Surface Temperature (SST) v2 (aka Reynolds OI.v2). We’re using it because (1) it is the longest running satellite-enhanced sea surface temperature dataset available, (2) its satellite data are bias adjusted based on temperature measurements from ship inlets and from buoys (both moored and drifting), and (3), most importantly, NOAA’s Reynolds OI.v2 data have been called “a good estimate of the truth”.
Tuesday, January 13, 2015
Greenland Summit Temperatures During the Holocene
The Back Story
I stumbled across this comment from dbstealey over at WUWT ...At times not so long ago geologically, temperatures changed by TENS of degrees, within only a decade or two! If that happened now it would be catastrophic.... wherein he kindly provided this graphic as supporting evidence:

Subscribe to:
Posts (Atom)